---
title: Report generation
description: "Cydarm has a number of built in reports that it can generate: The Case Details Report will provide tabular information, in a CSV file, of all cases that have been created or updated in the specified d"
---
[Skip to content](https://support.cydarm.com/en/knowledge/report-generation#main-content)
English
Show submenu for translations
[More support](https://support.cydarm.com/en/knowledge/kb-tickets/new?hsLang=en) [Customer portal](https://support.cydarm.com/tickets-view?hsLang=en)
.png?width=200&height=50&name=cydarm%202024%20logo%20blue%20on%20transparent%201000x250%20(3).png)
Open main navigation
Close main navigation
- English
Show submenu for translations
- [More support](https://support.cydarm.com/en/knowledge/kb-tickets/new)
- [Customer portal](https://support.cydarm.com/tickets-view)
- Contact us
Contact us
How can we help you?
- There are no suggestions because the search field is empty.
1. [Knowledge Base](https://support.cydarm.com/en/knowledge?hsLang=en)
2. [General](https://support.cydarm.com/en/knowledge/general?hsLang=en)
3. [User Guides](https://support.cydarm.com/en/knowledge/general?hsLang=en#user-guides)
# Report generation
## This article outlines the different types of reports available in Cydarm and how to use them.
### Overview
Cydarm has a number of built in reports that it can generate:
- Case Details Report
- Summary Report
- Tag Heat Map report
- Incident Report (located on the tab in the case view
### Case details report
The **Case Details Report** will provide tabular information, in a CSV file, of all cases that have been created or updated in the specified date range.
If you want only the cases created during the time period (for example, for weekly or monthly reporting purposes), the simplest way is to filter based upon the date in the **Triage** column, and remove any which were created prior to the specified date. Do note that the times in the report are in the UTC timezone, so you will need to factor this in.
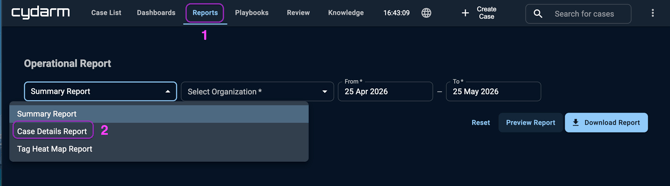
To generate this report, go to the **Reports** menu (1), select the **Reports** tab and then choose **Case Details Report** (2) from the dropdown. Select the organisation and date range. Additional filters can be applied to the report to select for Users, Tags and Severities. Click **Preview Report** to preview the results, and **Download Report** to download a CSV file.
### Summary report
The **Summary Report** provides an overview of operational activity in the specified date range. This report summarises the activity on all cases that have been in an *open* state during the specified date range.
The **Summary Report** contains a count of all the cases, the time spent in each workflow state, as well as frequency counts of tags and playbooks across those cases.
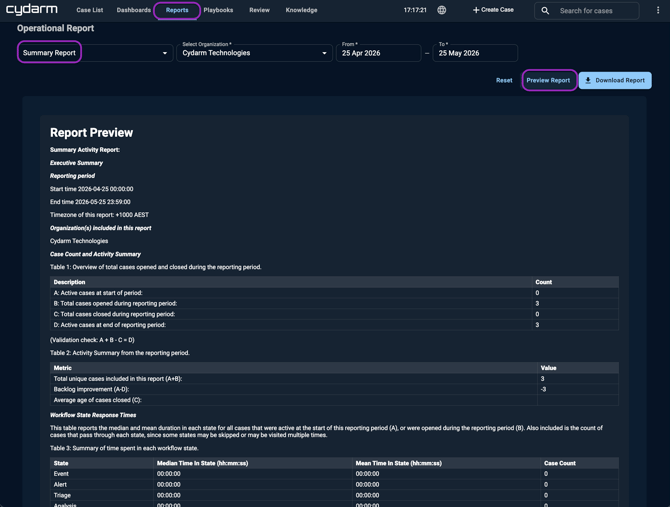
To generate this report, go to the **Metrics** menu, select the **Reports** tab and then choose **Summary Report** from the dropdown. Select the organisation and date range. Click **Preview Report** to preview the results, and **Download Report** to download a DOCX file.
###  Tag heat map report
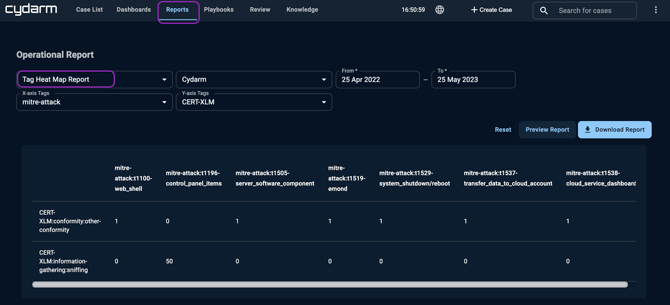
The **Tag Heat Map** report generates a matrix type heat map of tag groups. That is, it will show the number of cases that contain tags from both tag groups. This can be useful if your tagging scheme contains two groups of tags that you expect to apply to cases. For example, priority and category and category tag groups.
### Incident report
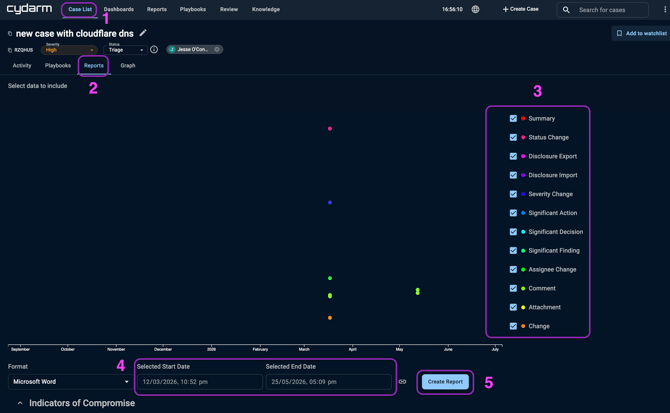
Generated directly from within a case, *Incident Reports* provide a downloadable summary of case activity in MS Word (.docx) or PDF format (4). To create one, locate your target case from the **Case List** (1) open it, and navigate to the **Reports** tab (2).
They can be filtered by the activity type and significance (3) as well as the date timeframe (4 )to customise and control the content that is included. You can find more information about generating incident reports on the [Incident report generation](https://support.cydarm.com/en/knowledge/situational-report-generation?hsLang=en) article.
Once you have selected what you would like to include in the report, click **Create Report** (5).
At the bottom of the case reports page, you'll find a consolidated list of **Indicators of Compromise,** complete with threat details and an instant cross-reference to any other cases where they’ve appeared.
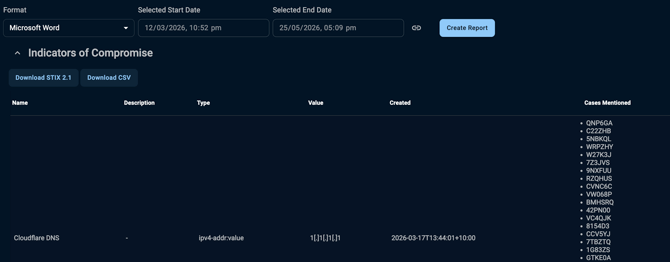
Note ❗️ If you would like your organisation logo to be included in the *Incident Report* (instead of the Cydarm logo) please log a support ticket requesting Incident report template customisation.
- [General](https://support.cydarm.com/en/knowledge/general?hsLang=en#main-content)
- [User Guides](https://support.cydarm.com/en/knowledge/general?hsLang=en#user-guides)
- [Updates & Release Notes](https://support.cydarm.com/en/knowledge/general?hsLang=en#updates-release-notes)
- [Playbooks](https://support.cydarm.com/en/knowledge/general?hsLang=en#playbooks)
- [Cydarm Administration](https://support.cydarm.com/en/knowledge/cydarm-administration?hsLang=en#main-content)
- [Authentication](https://support.cydarm.com/en/knowledge/cydarm-administration?hsLang=en#authentication)
- [Application Administration](https://support.cydarm.com/en/knowledge/cydarm-administration?hsLang=en#application-administration)
- [Integrations](https://support.cydarm.com/en/knowledge/cydarm-administration?hsLang=en#integrations)
- [API](https://support.cydarm.com/en/knowledge/cydarm-administration?hsLang=en#api)
[.png?width=200&height=50&name=cydarm%202024%20logo%20blue%20on%20transparent%201000x250%20(3).png "Cydarm Logo")](http://cydarm.com)
[mailto:email@email.com](mailto:email@email.com)
Copyright © 2026, Cydarm Technologies